Integrating Live Correlations: Data Overlays in Multi-Discipline Event Strategies
Written by Anna Peters · Aug 15, 2026
Integrating Live Correlations: Data Overlays in Multi-Discipline Event Strategies
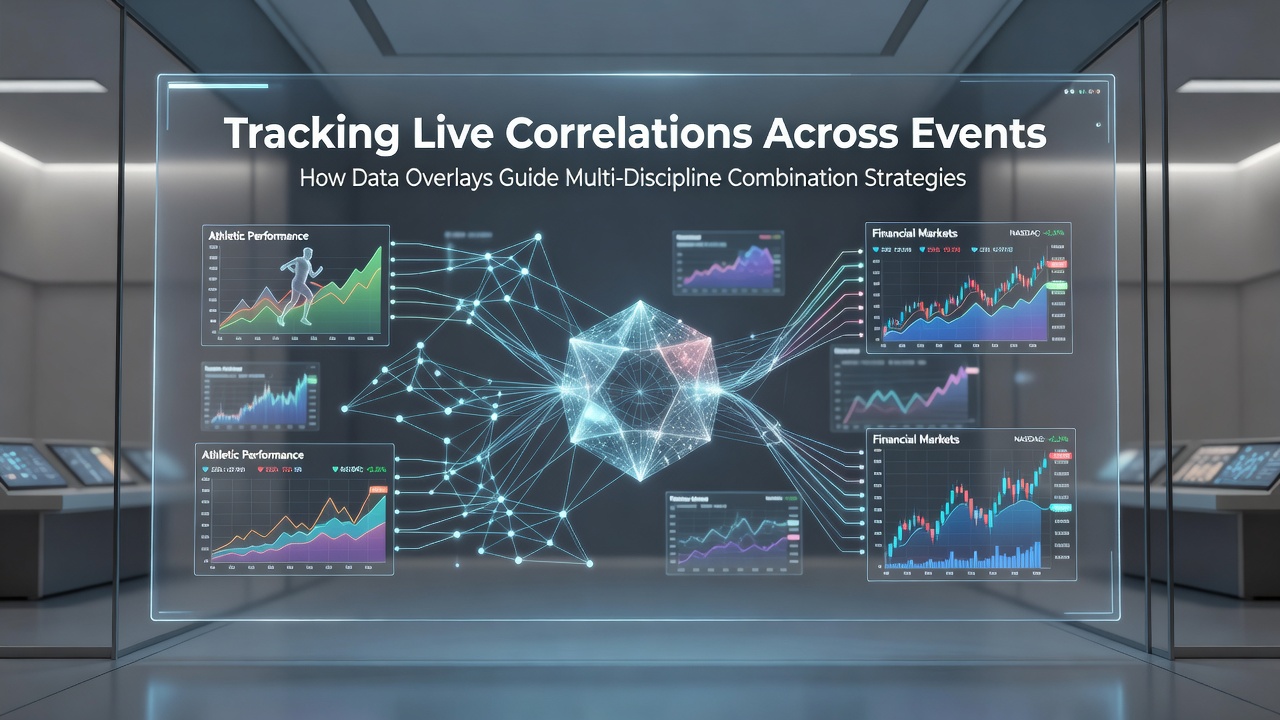
Analysts track live correlations across multiple events by layering real-time data streams from football, tennis, and horse racing onto unified platforms, and these overlays reveal patterns that inform combination strategies spanning disciplines. Data from timing systems, player performance metrics, and market movements sync in dashboards that update every few seconds during peak event windows. Researchers at institutions like the University of Queensland have documented how such integration highlights statistical relationships between outcomes in separate sports, particularly when events occur simultaneously on busy calendars.
Core Mechanisms of Data Overlays
Operators deploy software that merges feeds from disparate sources, including GPS tracking in football, serve statistics in tennis, and sectional times in racing, while algorithms flag deviations that exceed historical baselines. This setup allows for immediate comparison of momentum shifts across venues, and experts apply correlation coefficients to quantify how a late goal in one match aligns with service hold percentages in another. Figures from industry reports indicate that platforms processing over 50,000 data points per minute achieve higher precision in identifying cross-event linkages during summer tournament clusters.
August 2026 saw increased adoption of these tools ahead of overlapping major fixtures, with operators reporting streamlined workflows when overlays incorporated weather adjustments and injury updates from multiple jurisdictions. Observers note that Canadian regulatory filings and Australian wagering association summaries both reference similar technological upgrades in operator compliance documentation from that period.
Correlation Tracking in Practice
Live systems monitor variables such as possession dominance in football alongside break-point conversion rates in tennis, and they extend to pace figures in horse racing sprints. When a correlation threshold reaches predefined levels, alerts prompt adjustments to combination selections that link results across these fields. Studies published in sports analytics journals show that teams reviewing overlay outputs during live sessions reduce variance in projected returns compared to siloed analysis methods.
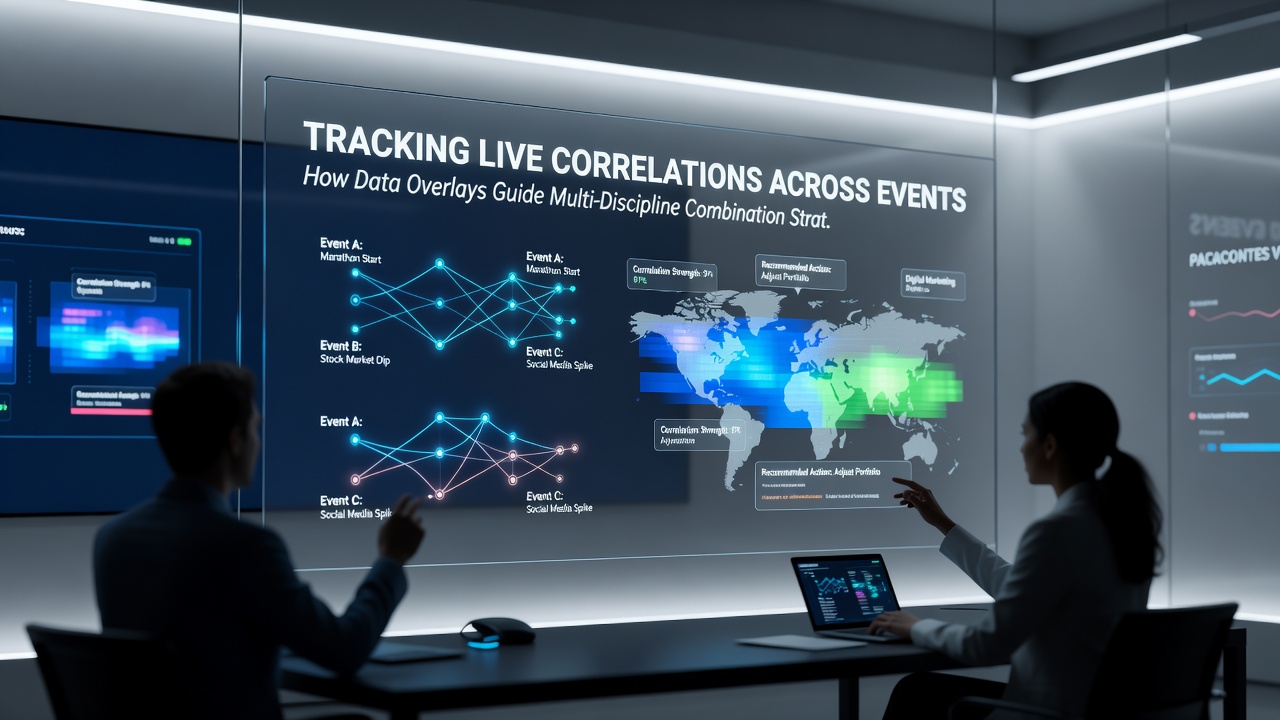
One documented workflow involves pulling European football league data alongside North American tennis circuits, then cross-referencing with Australasian racing meetings. Analysts apply time-stamped filters to isolate moments when performance spikes in one discipline coincide with market movements in others. This approach draws on datasets maintained by organizations including the Australian Sports Commission for integrity monitoring and academic repositories at institutions such as the National Institutes of Health sports performance archive for statistical modeling references.
Application to Combination Strategies
Combination approaches gain structure when overlays quantify how events in different disciplines influence shared risk profiles. Data points from August 2026 events demonstrated that simultaneous tracking of second-half goal distributions and clay-court rally lengths produced measurable alignment in certain market segments. Practitioners layer these insights onto accumulator frameworks by weighting selections according to real-time correlation strength rather than isolated probabilities.
Platforms update overlay models continuously as new inputs arrive, and they incorporate variables like travel fatigue across time zones or surface changes in multi-week circuits. Those who implement such systems report that the method supports dynamic rebalancing of selections as correlations evolve through the course of concurrent events.
Conclusion
Live correlation tracking through data overlays supplies structured inputs for multi-discipline combination strategies by connecting performance indicators across football, tennis, and horse racing. August 2026 developments underscored expanded use of these tools amid dense event schedules, with supporting data drawn from regulatory and research bodies in varied regions. Continued refinement of overlay algorithms promises further precision in identifying actionable linkages as event volumes grow.